U-TURN IN CUMMINSIND

cummins

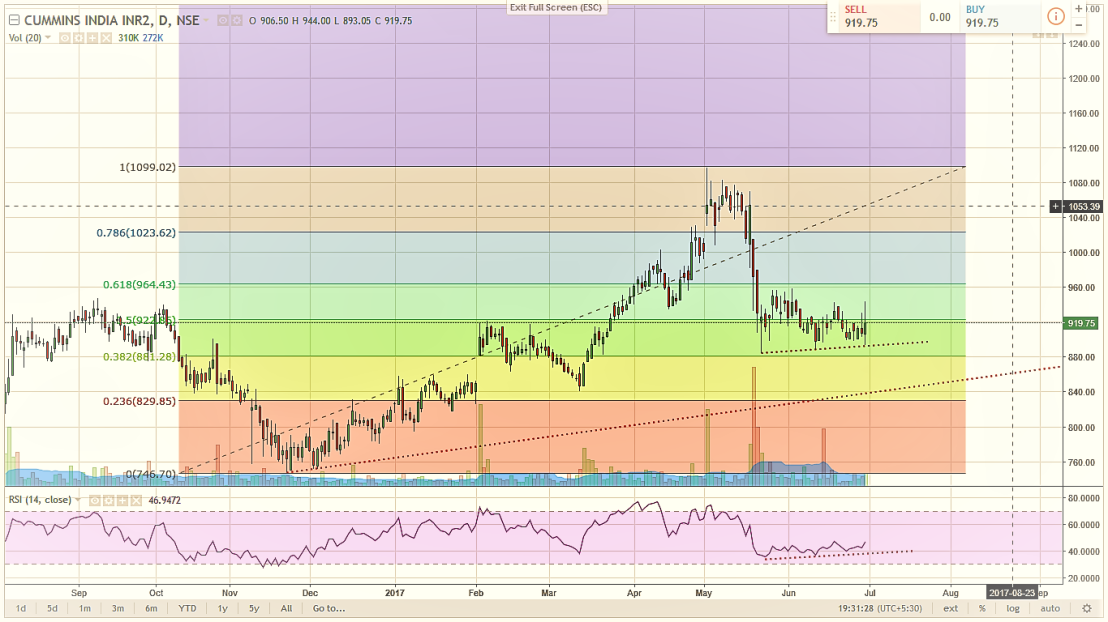
After result day Cummings India failed to reach market exception price sharply corrected from 1070 to 885 levels, But Still quarterly numbers are pretty well & ended up with 159cr profits. Technically now price has failed to break 38 percent retracement level 881 and Managed trade near above 50 percent retracement 992. Currently closed @ 919 -1.32% levels trades can buy in the range of 915 -900 levels with stoploss below 880 levels.

Happy Trading

For personalized trading solutions
jnaneshdshetty@gmail.com

Risk Disclaimer

ALL INFORMATION GIVEN HERE IS LARGELY BASED ON TECHNICAL ANALYSIS WHICH IS HIGHLY DYNAMIC IN NATURE AND RELEVANT ONLY AT A PARTICULAR POINT OF TIME. USERS ARE ADVISED TO PURSUE THESE RECOMMENDATIONS ONLY AT THEIR OWN RISK AND FIRST CONSULT THEIR PERSONAL INVESTMENT ADVISOR WHEN MAKING INVESTMENT DECISIONS. WE ARE NOT LIABLE AND WE DON’T TAKE ANY RESPONSIBILITY FOR ANY LOSS BY TRADING/INVESTING ON OUR RECOMMENDATIONS.THESE CHARTS ARE POSTED FOR EDUCATIONAL
PURPOSE ONLY.

TREND IS OUR FRIEND YES BANK TREND CONTINUATION

yes

The very first trend profit booking was happened near 1450 levels and price manged to correct sharply from the top to 1157 levels and finally price taken you turn @ 1090, Price moved on bullish trend made fresh high 1651.50 & vertically crashed taken support near Fibonacci 50% re-tracement zone after that failed make newer lower lows, there is minor trend line area support 1410 levels. Now the key concern for bullish trend expiry rollovers.

Happy Trading

For personalized trading solutions
jnaneshdshetty@gmail.com

Risk Disclaimer

ALL INFORMATION GIVEN HERE IS LARGELY BASED ON TECHNICAL ANALYSIS WHICH IS HIGHLY DYNAMIC IN NATURE AND RELEVANT ONLY AT A PARTICULAR POINT OF TIME. USERS ARE ADVISED TO PURSUE THESE RECOMMENDATIONS ONLY AT THEIR OWN RISK AND FIRST CONSULT THEIR PERSONAL INVESTMENT ADVISOR WHEN MAKING INVESTMENT DECISIONS. WE ARE NOT LIABLE AND WE DON’T TAKE ANY RESPONSIBILITY FOR ANY LOSS BY TRADING/INVESTING ON OUR RECOMMENDATIONS.THESE CHARTS ARE POSTED FOR EDUCATIONAL
PURPOSE ONLY.

GOLD TAKING SUPPORT FIBO 50%

xau-usd

After a long time trend line breakout near 1279 levels price recorded high of 1296 levels and sharply reversed from the top & recorded low 1240.71 near Fibonacci 50%. Its good indication that traders can buy from current levels(1250) or in the range of 1246 to 1250 levels with stoploss below 1236 levels. As per my view short term profit booking will be seen near 1297 to 1302 levels, If price survives anything above 1305 with volumes gold  trend will be completely bullish till 1350 levels. For more updates on Gold 0.37% stay update with my analysis

Happy trading

For personalized trading solutions
jnaneshdshetty@gmail.com

Risk Disclaimer

ALL INFORMATION GIVEN HERE IS LARGELY BASED ON TECHNICAL ANALYSIS WHICH IS HIGHLY DYNAMIC IN NATURE AND RELEVANT ONLY AT A PARTICULAR POINT OF TIME. USERS ARE ADVISED TO PURSUE THESE RECOMMENDATIONS ONLY AT THEIR OWN RISK AND FIRST CONSULT THEIR PERSONAL INVESTMENT ADVISOR WHEN MAKING INVESTMENT DECISIONS. WE ARE NOT LIABLE AND WE DON’T TAKE ANY RESPONSIBILITY FOR ANY LOSS BY TRADING/INVESTING ON OUR RECOMMENDATIONS.THESE CHARTS ARE POSTED FOR EDUCATIONAL
PURPOSE ONLY.

NSE : BAJAJ AUTO TRIANGLE BREAKOUT

Bajaj auto2

After a vertical crash from 3046 levels to 2757 levels price managed trade on side ways node for several days, Now price slowly picking up the momentum for shorter term traders can buy in the buy zone As there is triangle breakout in the charts, Price manged to open above 50MA with volumes these good indication for shorter term traders to trade. for more levels stay tuned!!

Happy trading

For personalized trading solutions
jnaneshdshetty@gmail.com

Risk Disclaimer

ALL INFORMATION GIVEN HERE IS LARGELY BASED ON TECHNICAL ANALYSIS WHICH IS HIGHLY DYNAMIC IN NATURE AND RELEVANT ONLY AT A PARTICULAR POINT OF TIME. USERS ARE ADVISED TO PURSUE THESE RECOMMENDATIONS ONLY AT THEIR OWN RISK AND FIRST CONSULT THEIR PERSONAL INVESTMENT ADVISOR WHEN MAKING INVESTMENT DECISIONS. WE ARE NOT LIABLE AND WE DON’T TAKE ANY RESPONSIBILITY FOR ANY LOSS BY TRADING/INVESTING ON OUR RECOMMENDATIONS.THESE CHARTS ARE POSTED FOR EDUCATIONAL
PURPOSE ONLY.

INDIABULLHSGFIN DETAILED FIBONACCI ANALYSIS

india

IBULLHSGFIN as recorded lowest low 177.50 on 19.09.13 and slowly price started recovering started making higher highs recorded fresh high 805 on 06.08.15 & moved to sideways slowly had a sharp correction & price halted near @ 61% and recorded low of 558. From there price manged to trade on higher highs recently price made high 1189 near 161% of Fibonacci. Currently Price traded near rising trend line with RSI Oscillator sharp Divergence. Now price is looking for correction where traders can en-cash by shorting  IBULHSGFINFUT-1.74% .

More updates will be posted on India Bulls Housing finance Stay updated

For personalized trading solutions
jnaneshdshetty@gmail.com

Risk Disclaimer

ALL INFORMATION GIVEN HERE IS LARGELY BASED ON TECHNICAL ANALYSIS WHICH IS HIGHLY DYNAMIC IN NATURE AND RELEVANT ONLY AT A PARTICULAR POINT OF TIME. USERS ARE ADVISED TO PURSUE THESE RECOMMENDATIONS ONLY AT THEIR OWN RISK AND FIRST CONSULT THEIR PERSONAL INVESTMENT ADVISOR WHEN MAKING INVESTMENT DECISIONS. WE ARE NOT LIABLE AND WE DON’T TAKE ANY RESPONSIBILITY FOR ANY LOSS BY TRADING/INVESTING ON OUR RECOMMENDATIONS.THESE CHARTS ARE POSTED FOR EDUCATIONAL
PURPOSE ONLY.

GOLD (XAUUSD) PULL BACK

goldnew.png

As Gold -0.02% is currently trading 1254 for shorter term its looks like traders can go long @ 1252 to 1253 levels with stoploss of 1250.50 levels, Take profit zones looks like 1258 to 1260 levels can be expected. The key concern of buying RSI in rising mode.

Happy Trading

For personalized trading solutions
jnaneshdshetty@gmail.com

Risk Disclaimer

ALL INFORMATION GIVEN HERE IS LARGELY BASED ON TECHNICAL ANALYSIS WHICH IS HIGHLY DYNAMIC IN NATURE AND RELEVANT ONLY AT A PARTICULAR POINT OF TIME. USERS ARE ADVISED TO PURSUE THESE RECOMMENDATIONS ONLY AT THEIR OWN RISK AND FIRST CONSULT THEIR PERSONAL INVESTMENT ADVISOR WHEN MAKING INVESTMENT DECISIONS. WE ARE NOT LIABLE AND WE DON’T TAKE ANY RESPONSIBILITY FOR ANY LOSS BY TRADING/INVESTING ON OUR RECOMMENDATIONS.THESE CHARTS ARE POSTED FOR EDUCATIONAL
PURPOSE ONLY.

SAFE TRADERS BOOK PROFITS IN BANK BARODA,TREND TRADERS HAVE PATIENCE !!

BOB2

As i posted to short signal Bank of Baroda on 23 May with target of 170, Yesterday price recorded low of 166.90. Today price managed trade on green, Yesterday in Inside range fresh minor trend line break out seen with avg volumes, Now trend traders can hold there short position with trailing stop loss of 183.5- 184 range, Fresh entries can enter @ 175 zone with above mentioned stop, As price is moving swinging mode i marked swing points. Open Interest is gaining its good for trend continuation, As RSI Oscillator is recovering from over sold zone small pull can be expected, Any where out side blue hollow box price can trailed on that zones.
Still there good strength on lower levels swing points are 159 levels , 153 levels & finally 148 levels can be expected.

The traders who exited with 1st take profit, The the risk and reward was 1:2
Lot size * Price Gained 3500*12= 42500 per lot profits
Trend traders position open.

Happy Trading

For personalized trading solutions
jnaneshdshetty@gmail.com

CRUDE OIL ANALYSIS

crude

As US Crude oil 0.52% current year price trading in thick range in between 54 $ to 43$ continuously price manged to trade on ascending trend line . Now price is trading @ 46.30 while writing this post, Traders can buy Crude oil 0.52% around 45.50 to 46 levels and manage to place your stop below 44 .40 levels, As per COT reports slowly long positions are building, upside levels looks like 50.50 & 52 levels looks like profit booking zone.

Happy Trading

For personalized trading solutions
jnaneshdshetty@gmail.com

Risk Disclaimer

ALL INFORMATION GIVEN HERE IS LARGELY BASED ON TECHNICAL ANALYSIS WHICH IS HIGHLY DYNAMIC IN NATURE AND RELEVANT ONLY AT A PARTICULAR POINT OF TIME. USERS ARE ADVISED TO PURSUE THESE RECOMMENDATIONS ONLY AT THEIR OWN RISK AND FIRST CONSULT THEIR PERSONAL INVESTMENT ADVISOR WHEN MAKING INVESTMENT DECISIONS. WE ARE NOT LIABLE AND WE DON’T TAKE ANY RESPONSIBILITY FOR ANY LOSS BY TRADING/INVESTING ON OUR RECOMMENDATIONS.THESE CHARTS ARE POSTED FOR EDUCATIONAL
PURPOSE ONLY.

CIPLA “Taking support near major Trendline”

cipla.png

Cipla after a sharp fall from 619 levels now price has halted near trend line support. RSI Oscillator from over sold (RSI30) sharply reversed to (RSI45).
Price has taken support near major trend line , & looks like Buying!! Traders can buy in the zone 502 to 525 range and maintain stoploss current recent low has price failure near the trend line .

Happy Trading

Feel free ask for Intraday trading signals  write us:
jnaneshdshetty@gmail.com

Risk Disclaimer

ALL INFORMATION GIVEN HERE IS LARGELY BASED ON TECHNICAL ANALYSIS WHICH IS HIGHLY DYNAMIC IN NATURE AND RELEVANT ONLY AT A PARTICULAR POINT OF TIME. USERS ARE ADVISED TO PURSUE THESE RECOMMENDATIONS ONLY AT THEIR OWN RISK AND FIRST CONSULT THEIR PERSONAL INVESTMENT ADVISOR WHEN MAKING INVESTMENT DECISIONS. WE ARE NOT LIABLE AND WE DON’T TAKE ANY RESPONSIBILITY FOR ANY LOSS BY TRADING/INVESTING ON OUR RECOMMENDATIONS.THESE CHARTS ARE POSTED FOR EDUCATIONAL
PURPOSE ONLY.